神经网络(NN)

 Deep Learning
create by Arwin Yu
Tutorial 01 - Neural Networks
 Agenda
- 感知机模型(Perceptron)
- 多层感知机(Multi-Layer Preceptron)
- 前向计算(Forward calulation)
- 反向传播(Backproagation)
- 基于神经网络的房价回归模型(Housing price regression)
- 权重初始化(Initialization of weights)
- 深度双重下降(Deep Double Descent)
 The Perceptron
-
第一个也是最简单的线性模型之一。
-
基于 线性阈值单元 (LTU):输入和输出是数字,每个连接都与一个权重相关联。
-
LTU 计算其输入的加权和:$z = w_1x_1 + w_2x_2 +....+w_nx_n = w^Tx$,然后对该和应用 阶跃函数 并输出结果:$$ h_w(x) = step(z) = step(w^Tx) $$
-
Illustration:

-
Pseudocode:
- Require: Learning rate $\eta$
- Require: Initial parameter $w$
- While stopping criterion not met do
- For $i=1,...,m$:
- $ w_{t+1} \leftarrow w_t +\eta(y_i -sign(w_t^Tx_i))x_i $
- $t \leftarrow t + 1$
- For $i=1,...,m$:
- end while
 Multi-Layer Perceptron (MLP)
-
MLP 由一个输入层、一个或多个隐藏层和一个最终输出层组成。
-
当隐藏层的数量大于 2 时,网络通常称为深度神经网络 (DNN),小于2成为MLP(一般情况下的一种习惯,不是定义)。
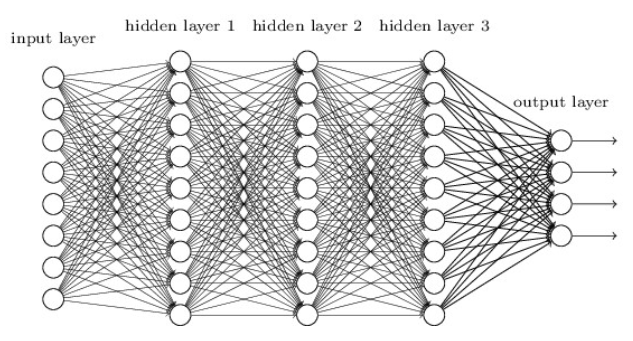
层级结构有什么用?
答案很简单,这是算法分析数据的方式。先类比一个生活中的例子以便理解:当我们看到一张图片时,是否可以瞬间就获得其中的信息?其实不是,我们需要一定的思考时间,从多个角度去分析理解图片数据中表达的信息;这就如同神经网络中的多个层级结构一样,神经网络模型就是依靠这些层级结构从不同角度下提取原始数据信息的。
从数学角度来讲,深度学习模型每层的感知机数量都不同,这相当于对原始数据进行升、降维,在不同的维度空间下提取原始数据的特征。不同维度空间又是什么意思?举个例子,现在使用一个简单的线性分类器,试图完美地对猫和狗进行分类。首先可以从一个特征开始,如“圆眼”特征,分类结果如下图所示。

由于猫和狗都是圆眼睛,此时无法获得完美的分类结果。因此,可能会决定增加其它特征,如“尖耳朵”特征,分类结果如下图。
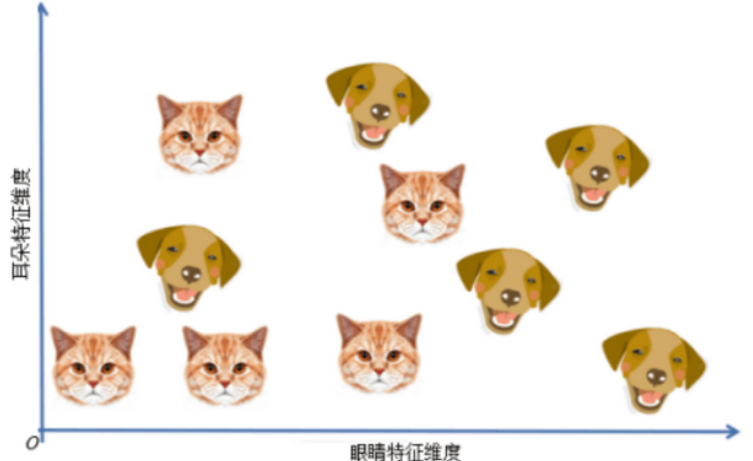
此时发现,猫和狗两个类型的数据分布渐渐离散,最后,增加第三个特征,例如“长鼻子”特征,得到一个三维特征空间,如下图。
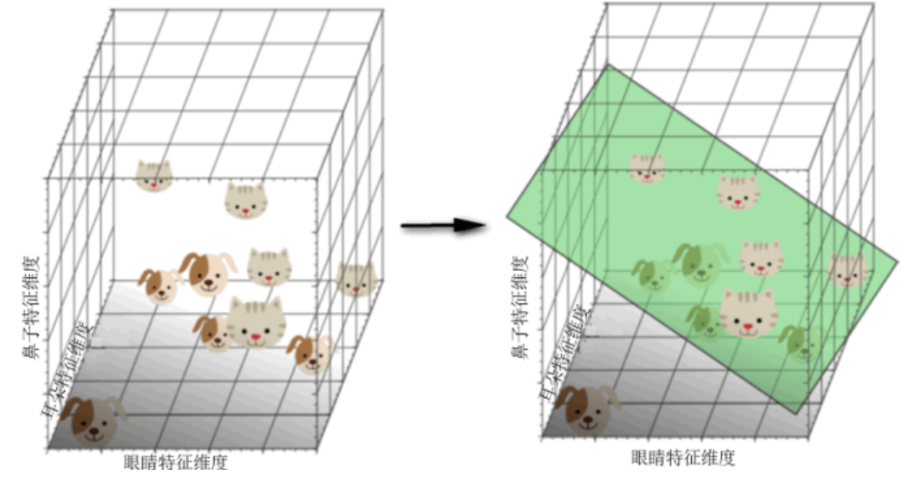
此时,模型已经可以很好地拟合出一个分类决策面对猫和狗两个类型进行分类了。那么很自然地联想一下:如果继续增加特征数量,将原始数据映射到更高维度的空间下是不是更有利于分类呢?
事实并非如此。注意当增加问题维数的时候, 训练样本的密度是呈指数下降的。假设 10 个训练实例涵盖了完整的一维特征空间,其宽度为 5 个单元间隔。因此,在一维情况下,样本密度为 10/5=2 (样本/间隔)。
在二维情况下,仍然有 10 个训练实例,现在它用 5×5=25 个单位正方形面积涵盖了二维的特征空间。因此,在二维情况下,样本密度为 10/25=0.4 (样本/间隔)。
最后, 在三维的情况下, 10 个样本覆盖了 5×5×5=125 个单位立方体特征空间体积。因此,在三维的情况下,样本密度为 10/125=0.08 (样本/间隔)。
如果不断增加特征,则特征空间的维数也在增长,并变得越来越稀疏。由于这种稀疏性,找到一个可分离的超平面会变得非常容易。如果将高维的分类结果映射到低维空间,与此方法相关联的严重问题就凸显出来。猫和狗在高纬度特征空间下的分类结果如下图所示。注意,因为高维特征空间难以在纸张上表示,下图是将高维空间的分类结果映射到二维空间下的展示。在这种情况下,模型训练的分类决策面可以非常轻易且完美地区分所有个体。
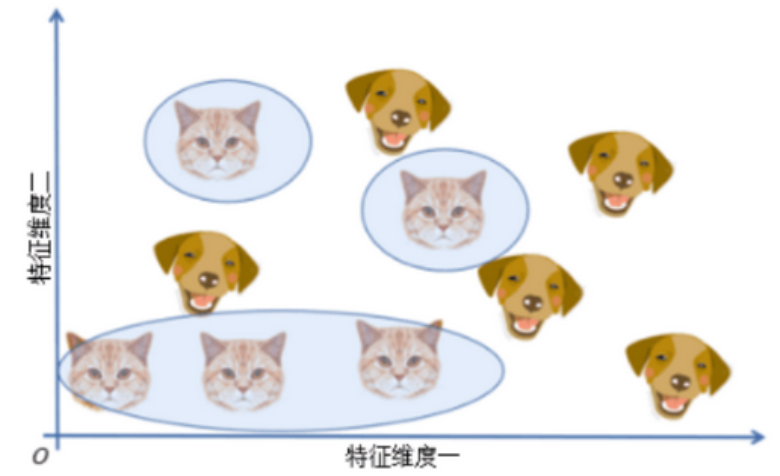
问题:对于训练数据做完美的区分,这岂不是很好吗?
其实不然,因为训练数据是取自真实世界的,且任何一个训练集都不可能包含大千世界中的全部情况。就好比采集猫狗数据集时不可能拍摄到全世界的所有猫狗一样。此时对于这个训练数据集做完美的区分实际上会固化模型的思维,使其在真实世界中的泛化能力很差。这个现象在生活中其实就是“钻牛角尖”。举个例子:假设我们费尽心思想出了一百种特征来定义中国的牛,这种严格的定义可以很容易地将牛与其他物种区分开来。但是有一天,一只英国的奶牛漂洋过海游到了中国。由于这只外国牛只有90种特征符合中国对牛的定义,就不把它定义为牛了。这种做法显然是不合理的,原因是特征空间的维度太高,把这种现象称为“维度诅咒”,当问题的维数变得比较大时,分类器的性能降低。
 Forward calculation
-
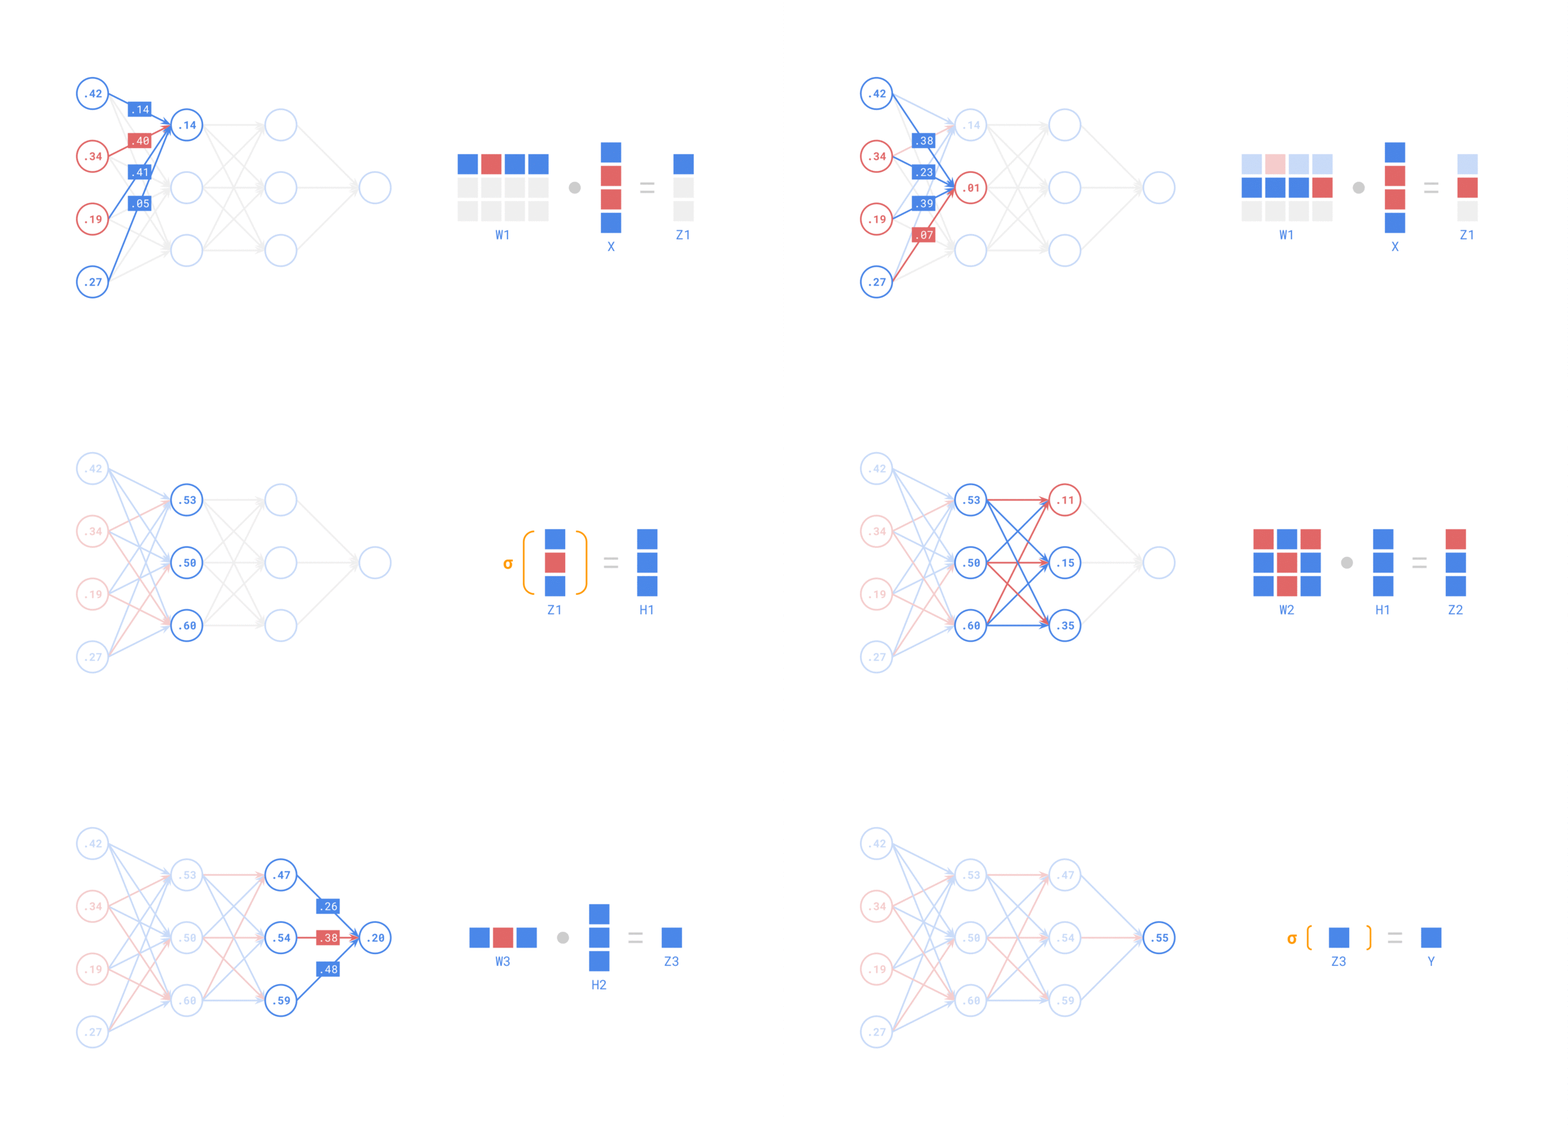
在 前向传递 中,对于每个训练实例,算法将其馈送到网络并计算每个连续层中每个神经元的输出
-
使用网络进行预测只是进行前向传递。
示例如下:
 Backpropagation
反向传播是一种有效的计算梯度的方法,它可以快速计算网络中每个神经元的偏导数。反向传播通过先正向传播计算网络的输出,然后从输出层到输入层反向传播误差,最后根据误差计算每个神经元的偏导数。反向传播算法的核心思想是通过链式法则将误差向后传递,计算每个神经元对误差的贡献。
示例如下:
初始化网络,构建一个只有一层的神经网络
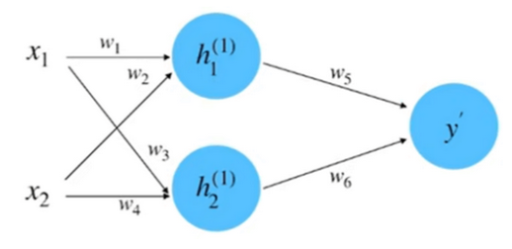
(1)初始化网络参数:
假设神经网络的输入和输出的初始化为: $x_1=0.5, x_2=1.0, y=0.8$ 。
参数的初始化为: $w_1=1.0, w_2=0.5, w_3=0.5, w_4=0.7, w_5=1.0, w_6=2.0$ 。
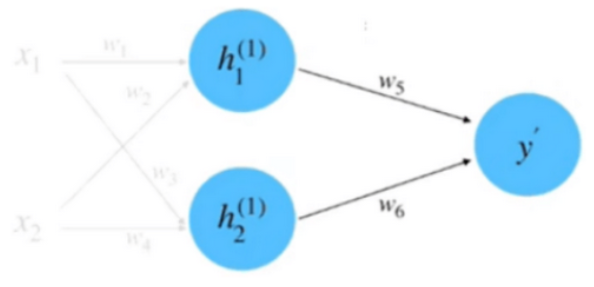
(2)前向计算, 如下图
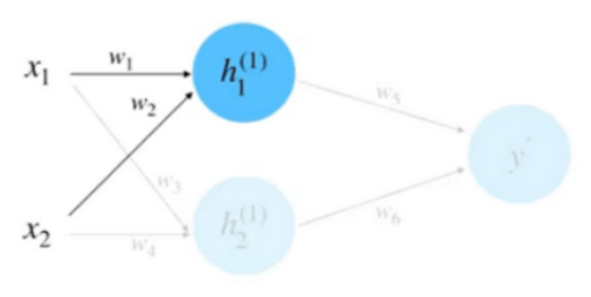
同理, 计算 $h_2$ 等于 0.95 。将 $h_1$ 和 $h_2$ 相乘求和到前向传播的计算结果, 如下图
$$
\begin{aligned}
y^{\prime} & =w_5 \cdot h_1^{(1)}+w_6 \cdot h_2^{(1)} \\
& =1.0 \cdot 1.0+2.0 \cdot 0.95 \\
& =2.9
\end{aligned}
$$
(3)计算损失: 根据数据真实值 $y=0.8$ 和平方差损失函数来计算损失
$$
\begin{aligned}
\delta & =\frac{1}{2}\left(y-y^{\prime}\right)^2 \\
& =0.5(0.8-2.9)^2 \\
& =2.205
\end{aligned}
$$
(4)计算梯度: 此过程实际上就是计算偏微分的过程, 以参数 $w_5$ 的偏微分计算为例, 如下图
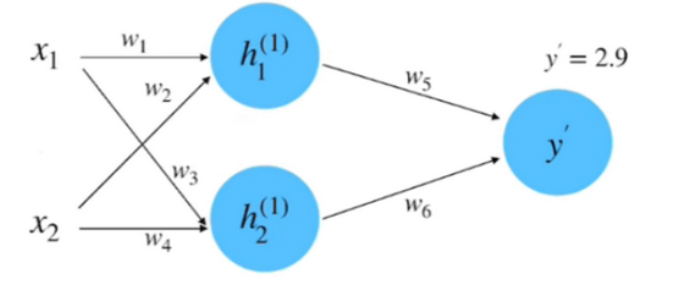
根据链式法则:
$$
\frac{\partial \delta}{\partial w_5}=\frac{\partial \delta}{\partial y^{\prime}} \cdot \frac{\partial y^{\prime}}{\partial w_5}
$$
其中:
$$
\begin{aligned}
\frac{\partial \delta}{\partial y^{\prime}} & =2 \cdot \frac{1}{2} \cdot\left(y-y^{\prime}\right)(-1) \\
& =y^{\prime}-y \\
& =2.9-0.8 \\
& =2.1 \\
y^{\prime} & =w_5 \cdot h_1^{(1)}+w_6 \cdot h_2^{(1)} \\
\frac{\partial y^{\prime}}{\partial w_5} & =h_1^{(1)}+0 \\
& =1.0
\end{aligned}
$$
所以:
$$
\frac{\partial \delta}{\partial w_5}=\frac{\partial \delta}{\partial y^{\prime}} \cdot \frac{\partial y^{\prime}}{\partial w_5}=2.1 \times 1.0=2.1
$$
类似的,如果以参数 $w_1$ 为例子, 它的偏微分计算就也用到链式法则, 过程如下所示。
$$
\begin{gathered}
\frac{\partial \delta}{\partial w_1}=\frac{\partial \delta}{\partial y^{\prime}} \cdot \frac{\partial y^{\prime}}{\partial h_1^{(1)}} \cdot \frac{\partial h_1^{(1)}}{\partial w_1} \\
y^{\prime}=w_5 \cdot h_1^{(1)}+w_6 \cdot h_2^{(1)} \\
\frac{\partial y^{\prime}}{\partial h_1^{(1)}}=w_5+0 \\
=1.0 \\
h_1^{(1)}=w_1 \cdot x_1+w_2 \cdot x_2 \\
\frac{\partial h_1^{(1)}}{\partial w_1}=x_1+0 \\
\frac{\partial \delta}{\partial w_1}=\frac{\partial \delta}{\partial y^{\prime}} \cdot \frac{\partial y^{\prime}}{\partial h_1^{(1)}} \cdot \frac{\partial h_1^{(1)}}{\partial w_1}=2.1 \times 1.0 \times 0.5=1.05
\end{gathered}
$$
(5)梯度下降更新网络参数:假设这里的超参数 “学习速率” 的初始值为 0.1 , 根据梯度下降的更新公式, $w_1$ 参数的更新计算如下所示:
$$
w_1^{\text {(update) }}=w_1-\eta \cdot \frac{\partial \delta}{\partial w_1}=1.0-0.1 \times 1.05=0.895
$$
同理, 可以计算得到其他的更新后的参数:
$$
w_1=0.895, w_2=0.895, w_3=0.29, w_4=0.28, w_5=0.79, w_6=1.8005
$$
到此为止, 我们就完成了参数迭代的全部过程。可以计算一下损失看看是否有减小, 计算如下:
$$
\begin{aligned}
\delta & =\frac{1}{2}\left(y-y^{\prime}\right)^2 \\
& =0.5(0.8-1.3478)^2 \\
& =0.15
\end{aligned}
$$
此结果相比较于之间计算的前向传播的结果 2.205 , 是有明显的减小的。
 常用层
常用层
- 线性层(输入的线性组合)。
- 激活层(通常与线性层一起使用,对加权输入的线性组合应用函数):ReLU、Binary Step、Sigmoid、TanH 等...
- Softmax 层(超过 2 个类的 Sigmoid,输出每个类的概率)用于分类任务。
- 损失函数层(例如 MSE 和交叉熵)。
 示例 - 回归神经网络 - 房价
- 房价数据集:
- 两个输入特征:Size 和 Floor
- 一个输出:房价
- 损失函数:MSE
- 网络架构:2 个隐藏层,一个输出层
Layout:

$$ F(X,W) = W_3^T \phi_2(W_2^T\phi_1(W_1^TX + b_1) + b_2) + b_3 $$
Where: $$ X \in \mathbb{R}^2 $$ $$ W_1 \in \mathbb{R}^{2 \times 4} $$ $$ W_2 \in \mathbb{R}^{4 \times 3} $$ $$ W_3 \in \mathbb{R}^{3 \times 1} $$ $$ b_1 \in \mathbb{R}^4 $$ $$ b_2 \in \mathbb{R}^3 $$ $$ b_3 \in \mathbb{R} $$
 分步解决方案
-
所有训练示例 $x_i$ 的 MSE 损失函数和相应的训练目标: $$ Error = \frac{1}{N} \sum_{i=1}^N (F(x_i, W) - y_i)^2 = \frac{1}{N} ||F(X, W) - Y||_2^2 $$
-
线性层: $$ u_{out} = W^Tu_{in} + b $$
-
激活层:
-
$\phi_1$ 和 $\phi_2$ 是多元向量 非线性 函数,因此: $$ \phi(U) = \phi\left(\begin{bmatrix} u_1 \\ \vdots \\ u_n \end{bmatrix}\right) = \begin{bmatrix} \phi(u_1) \\ \vdots \\ \phi(u_n) \end{bmatrix} $$
-
对于 ReLU: $$ \begin{bmatrix} \phi(u_1) \\ \vdots \\ \phi(u_n) \end{bmatrix} = \begin{bmatrix} \max(0, u_1) \\ \vdots \\ \max(0, u_n) \end{bmatrix} $$
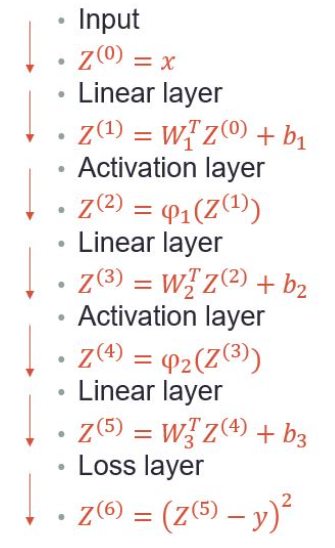
 Forward Pass
$$ F(X,W) = W_3^T \phi_2(W_2^T\phi_1(W_1^TX + b_1) + b_2) + b_3 $$
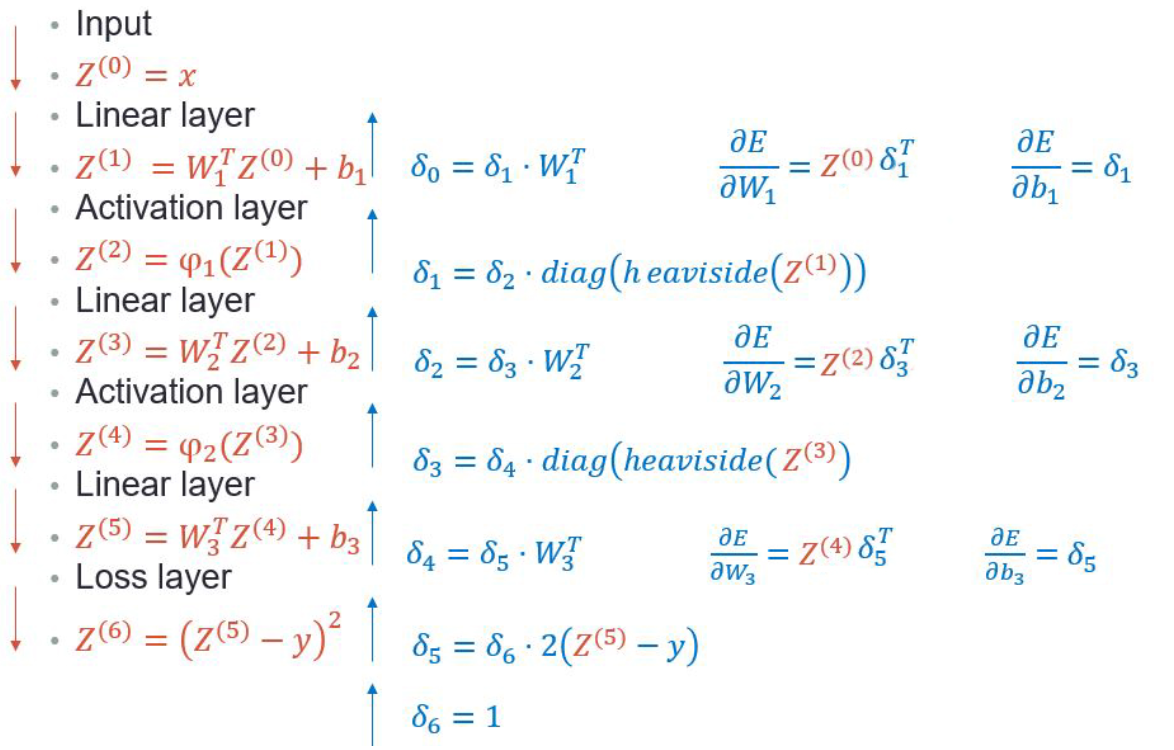
 Backward Pass
The following illustration depicts the backpropagation process:
 使用 PyTorch 构建神经网络
现在我们将使用 PyTorch 实现一个用于回归的神经网络。我们将使用“波士顿房价”数据集并使用上面描述的架构。
import torch
import torch.nn as nn
# define our neural network model
# this approach provides easier access to weights (e.g., 'model.fc1' will return the parameters of the first layer)
class HousePricesMLP(nn.Module):
    # notice that we inherit from nn.Module
    def __init__(self, input_dim, output_dim):
        super(HousePricesMLP, self).__init__()
        # here we initialize the building blocks of our network
        # single neuron is just one linear (fully-connected) layer
        self.fc_1 = nn.Linear(input_dim, 4)
        self.fc_2 = nn.Linear(4, 3)
        self.output_layer = nn.Linear(3, output_dim)

    def forward(self, x):
        # here we define what happens to the input x in the forward pass
        # that is, the order in which x goes through the building blocks
        x = torch.relu(self.fc_1(x))
        x = torch.relu(self.fc_2(x))
        return self.output_layer(x)
# alternative method - more readdable, easier to code, less convenient access to weights
# e.g., to access the first layer weights -- `model.hidden[0]`
class HousePricesMLP(nn.Module):
# notice that we inherit from nn.Module
def __init__(self, input_dim, output_dim):
super(HousePricesMLP, self).__init__()
# here we initialize the building blocks of our network
# single neuron is just one linear (fully-connected) layer
self.hidden = nn.Sequential(nn.Linear(input_dim, 4),
nn.ReLU(),
nn.Linear(4, 3),
nn.ReLU())
self.output_layer = nn.Linear(3, output_dim)
def forward(self, x):
# here we define what happens to the input x in the forward pass
# that is, the order in which x goes through the building blocks
return self.output_layer(self.hidden(x))# NOTE: in this example we are using a very simple NN model
# We usually wider and deeper networks such as this one:
class HousePricesMLP(nn.Module):
# notice that we inherit from nn.Module
def __init__(self, input_dim, output_dim, hidden_dim=256):
super(HousePricesMLP, self).__init__()
# here we initialize the building blocks of our network
# single neuron is just one linear (fully-connected) layer
self.hidden = nn.Sequential(nn.Linear(input_dim, hidden_dim),
nn.ReLU(),
nn.Linear(hidden_dim, hidden_dim),
nn.ReLU(),
nn.Linear(hidden_dim, hidden_dim),
nn.ReLU(),)
self.output_layer = nn.Linear(hidden_dim, output_dim)
def forward(self, x):
# here we define what happens to the input x in the forward pass
# that is, the order in which x goes through the building blocks
return self.output_layer(self.hidden(x))from sklearn.datasets import fetch_california_housing
import pandas as pd
# Load data
california_housing = fetch_california_housing()
# Convert to DataFrame
data = pd.DataFrame(california_housing.data, columns=california_housing.feature_names)
data['target'] = california_housing.target
# Print description of the features
print(california_housing.DESCR)
.. _california_housing_dataset:

California Housing dataset
--------------------------

**Data Set Characteristics:**

    :Number of Instances: 20640

    :Number of Attributes: 8 numeric, predictive attributes and the target

    :Attribute Information:
        - MedInc        median income in block group
        - HouseAge      median house age in block group
        - AveRooms      average number of rooms per household
        - AveBedrms     average number of bedrooms per household
        - Population    block group population
        - AveOccup      average number of household members
        - Latitude      block group latitude
        - Longitude     block group longitude

    :Missing Attribute Values: None

This dataset was obtained from the StatLib repository.
https://www.dcc.fc.up.pt/~ltorgo/Regression/cal_housing.html

The target variable is the median house value for California districts,
expressed in hundreds of thousands of dollars ($100,000).

This dataset was derived from the 1990 U.S. census, using one row per census
block group. A block group is the smallest geographical unit for which the U.S.
Census Bureau publishes sample data (a block group typically has a population
of 600 to 3,000 people).

A household is a group of people residing within a home. Since the average
number of rooms and bedrooms in this dataset are provided per household, these
columns may take surprisingly large values for block groups with few households
and many empty houses, such as vacation resorts.

It can be downloaded/loaded using the
:func:sklearn.datasets.fetch_california_housing function.

.. topic:: References

    - Pace, R. Kelley and Ronald Barry, Sparse Spatial Autoregressions,
      Statistics and Probability Letters, 33 (1997) 291-297
# Convert to DataFrame
boston = pd.DataFrame(california_housing.data, columns=california_housing.feature_names)
boston['MEDV'] = california_housing.target
# Sample 10 rows
sampled_data = boston.sample(10)
print(sampled_data)
       MedInc  HouseAge  AveRooms  AveBedrms  Population  AveOccup  Latitude  \
11143  3.1884      25.0  5.188630   1.073643      2166.0  2.798450     33.84
9961   5.8150      34.0  7.670412   1.183521       780.0  2.921348     38.33
12213  6.9930      13.0  6.428571   1.000000       120.0  2.857143     33.51
4354   8.9440      30.0  7.170455   1.087500      1776.0  2.018182     34.10
4629   2.2708      18.0  2.571135   1.108755      3296.0  2.254446     34.07
11026  5.8622      30.0  6.456164   1.038356      2271.0  3.110959     33.80
20185  5.9181      24.0  5.700000   1.034375      1049.0  3.278125     34.27
17427  2.3333      32.0  5.816976   1.140584      1074.0  2.848806     34.65
4080   3.1373      23.0  3.752241   1.074980      2391.0  1.948655     34.15
13890  2.2612      12.0  5.235714   1.024405     11139.0  6.630357     34.45

       Longitude     MEDV
11143    -117.94  1.35400
9961     -122.26  3.39200
12213    -117.18  5.00001
4354     -118.39  5.00001
4629     -118.30  1.75000
11026    -117.83  2.21000
20185    -119.16  2.21100
17427    -120.47  1.30200
4080     -118.37  2.63100
13890    -116.14  1.37500
from sklearn.model_selection import train_test_split
from sklearn.preprocessing import StandardScaler
# Use 2 features
x = boston[['AveRooms', 'AveOccup']].values # AveRooms - average number of rooms, AveOccup - average number of household members
y = boston['MEDV'].values
# Split the data
x_train, x_test, y_train, y_test = train_test_split(x, y, test_size=0.2, random_state=5)
# Scaling
x_scaler = StandardScaler()
x_scaler.fit(x_train)
x_train = x_scaler.transform(x_train)
x_test = x_scaler.transform(x_test)
print("total training samples: {}, total test samples: {}".format(len(x_train), len(x_test)))total training samples: 16512, total test samples: 4128import torch
from torch.utils.data import TensorDataset, DataLoader
import torch.nn as nn
# Convert to tensor dataset for PyTorch
boston_tensor_train_ds = TensorDataset(torch.tensor(x_train, dtype=torch.float), torch.tensor(y_train, dtype=torch.float))
boston_tensor_test_ds = TensorDataset(torch.tensor(x_test, dtype=torch.float), torch.tensor(y_test, dtype=torch.float))
# Check
print(f'sample 0: features: {boston_tensor_train_ds[0][0]}, target: {boston_tensor_train_ds[0][1]}')
# Define hyper-parameters and create our model
num_features = 2
output_dim = 1
batch_size = 128
learning_rate = 0.01
num_epochs = 200
# Device
device = torch.device("cuda:0" if torch.cuda.is_available() else "cpu")
# Loss criterion
criterion = nn.MSELoss()
# Model
model = HousePricesMLP(num_features, output_dim).to(device)
# Optimizer
optimizer = torch.optim.Adam(model.parameters(), lr=learning_rate)
# DataLoader
train_loader = DataLoader(boston_tensor_train_ds, batch_size=batch_size, shuffle=True)
test_loader = DataLoader(boston_tensor_test_ds, batch_size=batch_size, shuffle=False)
sample 0: features: tensor([-0.7866, -0.0164]), target: 2.8459999561309814# Training loop
for epoch in range(num_epochs):
model.train()
for inputs, targets in train_loader:
inputs, targets = inputs.to(device), targets.to(device)
# Zero the parameter gradients
optimizer.zero_grad()
# Forward pass
outputs = model(inputs).view(-1)
loss = criterion(outputs, targets)
# Backward pass and optimization
loss.backward()
optimizer.step()
# Print loss for every 10 epochs
if (epoch+1) % 10 == 0:
print(f'Epoch [{epoch+1}/{num_epochs}], Loss: {loss.item():.4f}')
# Evaluation
model.eval()
with torch.no_grad():
test_loss = 0
for inputs, targets in test_loader:
inputs, targets = inputs.to(device), targets.to(device)
outputs = model(inputs).view(-1)
loss = criterion(outputs, targets)
test_loss += loss.item()
test_loss /= len(test_loader)
print(f'Test Loss: {test_loss:.4f}')Epoch [10/200], Loss: 1.0621
Epoch [20/200], Loss: 1.0323
Epoch [30/200], Loss: 0.8559
Epoch [40/200], Loss: 1.3087
Epoch [50/200], Loss: 1.1804
Epoch [60/200], Loss: 1.0741
Epoch [70/200], Loss: 1.0675
Epoch [80/200], Loss: 0.9341
Epoch [90/200], Loss: 0.6055
Epoch [100/200], Loss: 1.0619
Epoch [110/200], Loss: 1.0063
Epoch [120/200], Loss: 0.9453
Epoch [130/200], Loss: 0.9202
Epoch [140/200], Loss: 0.9076
Epoch [150/200], Loss: 0.8739
Epoch [160/200], Loss: 1.0152
Epoch [170/200], Loss: 0.7826
Epoch [180/200], Loss: 0.8854
Epoch [190/200], Loss: 1.0572
Epoch [200/200], Loss: 0.9545
Test Loss: 1.0264 权重初始化
权重初始化
- 正如我们所了解的,神经网络是使用随机优化算法进行训练的,例如梯度下降、RMSprop、Adam 等...
- 回想一下,这些算法需要将参数初始化为某些值。也就是说,它们使用随机性来为正在学习的数据中从输入到输出的特定映射函数找到一组足够好的权重。
- 这些算法要求将网络的权重初始化为较小的随机值(随机,但接近于零)。
- 在每个时期之前对训练数据集进行打散的搜索过程中也会使用随机性,这反过来会导致每个批次的梯度估计值不同。
- 训练深度模型是一项相当困难的任务,大多数算法都受到初始化选择的强烈影响(第 301 页,深度学习,2016 年)。
 为什么不直接用零初始化?
Recent Trend: Non-Random Initializations
-
Beyond Signal Propagation: Is Feature Diversity Necessary in Deep Neural Network Initialization?, 这篇论文中,通过将几乎所有权重初始化为0,构建了一个具有相同特征的深度网络。该架构不仅实现了完美的信号传播和稳定的梯度,还在标准基准测试中取得了很高的准确率,表明随机多样化的初始化并不是训练神经网络所必需的。
-
ZerO Initialization: Initializing Neural Networks with only Zeros and Ones, 这篇论文中,随机权重初始化被完全确定性的初始化方案所取代,该方案使用零和一(经过归一化处理)来初始化网络权重,基于身份和哈达玛变换。他们在各种基准测试中显示出了令人鼓舞的结果,为简单的初始化方案铺平了道路,这些方案在效果上与随机初始化一样好。
这些研究显示,神经网络不一定需要随机初始化权重来取得好的训练效果。
 权重初始化的类型
-
神经网络权重的初始化是一个活跃的研究领域,因为仔细初始化网络可以加快学习过程。
-
没有单一的最佳方法来初始化神经网络的权重。
-
我们将回顾一些流行的初始化方法。
-
Unifrom - 使用从均匀分布 $\mathcal{U}(a, b)$ 中抽取的值进行初始化
-
在 PyTorch 中 -
torch.nn.init.uniform_(tensor, a=0.0, b=1.0) -
Normal - 使用从正态分布 $\mathcal{N}(\text{mean}, \text{std}^2)$ 中抽取的值进行初始化
-
在 PyTorch 中 -
torch.nn.init.normal_(tensor, mean=0.0, std=1.0) -
Constant - 使用值 $val$ 进行初始化。
-
在 PyTorch 中 -
torch.nn.init.constant_(tensor, val) -
Ones - 用标量值 1 初始化。
-
在 PyTorch 中 -
torch.nn.init.ones_(tensor) -
Zeros - 用标量值 0 初始化。
-
在 PyTorch 中 -
torch.nn.init.zeros_(tensor) -
Xavier Unifrom - 根据Understanding the difficulty of training deep feedforward neural networks - Glorot, X. & Bengio, Y. (2010),中描述的方法,使用均匀分布进行值初始化。生成的张量将具有从 $\mathcal{U}(-a, a)$ 中采样的值,其中$$ a = \text{gain} \times \sqrt{\frac{6}{\text{fan}_{in} + \text{fan}_{out}}} $$
-
fan_in是权重张量中的输入单元数,fan_out是权重张量中的输出单元数,gain的主要作用是调整初始化权重的尺度,使得信号在网络中传递时不会出现梯度消失或梯度爆炸的问题。 -
在 PyTorch 中 -
torch.nn.init.xavier_uniform_(tensor, gain=1.0) -
Xavier Normal - 根据 理解训练深度前馈神经网络的难度 - Glorot, X. & Bengio, Y. (2010) 中描述的方法使用正态分布初始化值。生成的张量将具有从 $\mathcal{N}(0,\text{std}^2)$ 中采样的值,其中 $$ \text{std} = \text{gain} \times \sqrt{\frac{2}{\text{fan}_{in} + \text{fan}_{out}}} $$
-
fan_in是权重张量中的输入单元数,fan_out是权重张量中的输出单元数 -
在 PyTorch 中 -
torch.nn.init.xavier_normal_(tensor, gain=1.0) -
Kaiming (He) Uniform - 根据 Delving deep into rectifiers: Surpassing human-level performance on ImageNet classification - He, K. et al. (2015), 中描述的方法使用均匀分布初始化值。生成的张量将具有从 $\mathcal{U}(-\text{bound}, \text{bound})$ 中采样的值,其中 $$ \text{bound} = \text{gain} \times \sqrt{\frac{3}{\text{fan-mode}}} $$
-
在 PyTorch 中 -
torch.nn.init.kaiming_uniform_(tensor, a=0, mode='fan_in', nonlinearity='leaky_relu') -
a- 使用leaky_relu的负斜率(仅与leaky_relu一起使用) -
gain:缩放因子,通常对于ReLU和Leaky ReLU为$sqrt{2}$。 -
fan_mode:可以是fan_in或fan_out。 -
fan_in:表示权重张量中的输入单元数(上一层神经元的数量)。这意味着在初始化时,考虑的是每个神经元在前向传播中的输入数量,以确保信号不会在传递过程中变得过大或过小。 -
fan_out:表示权重张量中的输出单元数(下一层神经元的数量)。这意味着在初始化时,考虑的是每个神经元在反向传播中的输出数量,以确保梯度不会在传播过程中变得过大或过小。
在初始化时,fan_in和fan_out都是基于权重张量的形状(尺寸)计算的,这些形状在网络结构定义时就已经确定。例如,对于一个全连接层,其权重张量的形状是$[ \text{fan_out}, \text{fan_in} ]$。
- Kaiming (He) Normal - 根据 Delving deep into rectifiers: Surpassing human-level performance on ImageNet classification - He, K. et al. (2015), 中描述的方法使用正态分布初始化值。生成的张量将具有从 $\mathcal{N}(0,\text{std}^2)$ 采样的值,其中 $$ \text{std} = \frac{\text{gain}}{\sqrt{\text{fan-mode}}} $$
- 在 PyTorch 中 -
torch.nn.init.kaiming_normal_(tensor, a=0, mode='fan_in', nonlinearity='leaky_relu')
PyTorch 具有通常效果良好的默认初始化方案。例如,kaiming_uniform 是 PyTorch 中用于 Linear 层的默认初始化:
Interactive Demo
Different Initializations Demo
 使用 PyTorch 初始化神经网络权重
- 从 PyTorch 1.0 开始,大多数层默认使用 Kaiming Uniform 方法初始化。
- 让我们看看如何更改模型的初始化。
- 官方 PyTorch 初始化文档。
# define hyper-parmeters and create our model
num_features = 2
output_dim = 1
batch_size = 128
learning_rate = 0.01
num_epochs = 500
# device
device = torch.device("cuda:0" if torch.cuda.is_available() else "cpu")
# loss criterion
criterion = nn.MSELoss()
# model
model = HousePricesMLP(num_features, output_dim).to(device)
# optimizer
optimizer = torch.optim.Adam(model.parameters(), lr=learning_rate)
# use a different initialization for the model
def weights_init(m):
classname = m.__class__.__name__
if classname.find('Linear') != -1:
torch.nn.init.xavier_normal_(m.weight, gain=1.0)
model.apply(weights_init)HousePricesMLP(
(hidden): Sequential(
(0): Linear(in_features=2, out_features=256, bias=True)
(1): ReLU()
(2): Linear(in_features=256, out_features=256, bias=True)
(3): ReLU()
(4): Linear(in_features=256, out_features=256, bias=True)
(5): ReLU()
)
(output_layer): Linear(in_features=256, out_features=1, bias=True)
)# another way to do that
class HousePricesMLP(nn.Module):
def __init__(self, input_dim, output_dim):
super(HousePricesMLP, self).__init__()
self.hidden = nn.Sequential(nn.Linear(input_dim, 4),
nn.ReLU(),
nn.Linear(4, 3),
nn.ReLU())
self.output_layer = nn.Linear(3, output_dim)
# NEW: init weights here
self.init_weights()
def forward(self, x):
return self.output_layer(self.hidden(x))
def init_weights(self):
for m in self.modules():
if isinstance(m, nn.Linear):
torch.nn.init.xavier_normal_(m.weight, gain=1.0)
if m.bias is not None:
torch.nn.init.constant_(m.bias, 0)import numpy as np
boston_tensor_train_dataloader = DataLoader(boston_tensor_train_ds, batch_size=batch_size, shuffle=True)
# training loop for the model
for epoch in range(num_epochs):
epoch_losses = []
for features, targets in boston_tensor_train_dataloader:
# send data to device
features = features.to(device)
targets = targets.to(device)
# forward pass
output = model(features)
# loss
loss = criterion(output.view(-1), targets)
# backward pass
optimizer.zero_grad() # clean the gradients from previous iteration
loss.backward() # autograd backward to calculate gradients
optimizer.step() # apply update to the weights
epoch_losses.append(loss.item())
if epoch % 50 == 0:
print(f'epoch: {epoch} loss: {np.mean(epoch_losses)}')
# test error
model.eval()
with torch.no_grad():
test_outputs = model(torch.tensor(x_test, dtype=torch.float, device=device))
test_error = criterion(test_outputs.view(-1), torch.tensor(y_test, dtype=torch.float, device=device))
print(f'test MSE error: {test_error.item()}')epoch: 0 loss: 1.3302481183710024
epoch: 50 loss: 0.9436245888702629
epoch: 100 loss: 0.9447847960531249
epoch: 150 loss: 0.9419918522354245
epoch: 200 loss: 0.9397756309472314
epoch: 250 loss: 0.9362258513768514
epoch: 300 loss: 0.9383858072665311
epoch: 350 loss: 0.9368446367655614
epoch: 400 loss: 0.936691609926002
epoch: 450 loss: 0.9354286706724833
test MSE error: 0.9552490711212158 深度双重下降(Deep Double Descent)
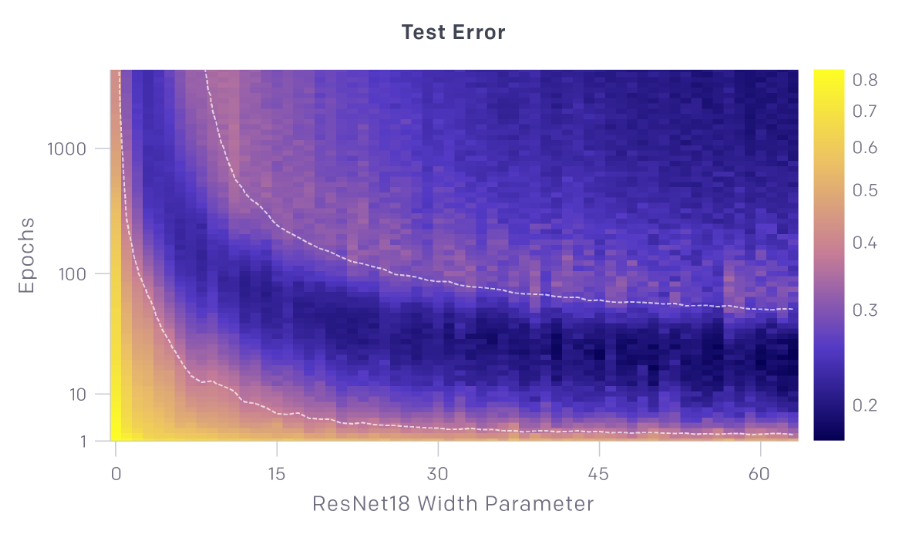
- 机器学习算法训练中的双重下降:随着模型大小、数据大小或训练时间的增加,性能首先提高,然后变差,然后再次提高。
- 通常可以通过仔细的正则化或提前停止来避免这种影响。
- 虽然这种行为似乎相当普遍,但我们还不完全理解它为什么会发生。
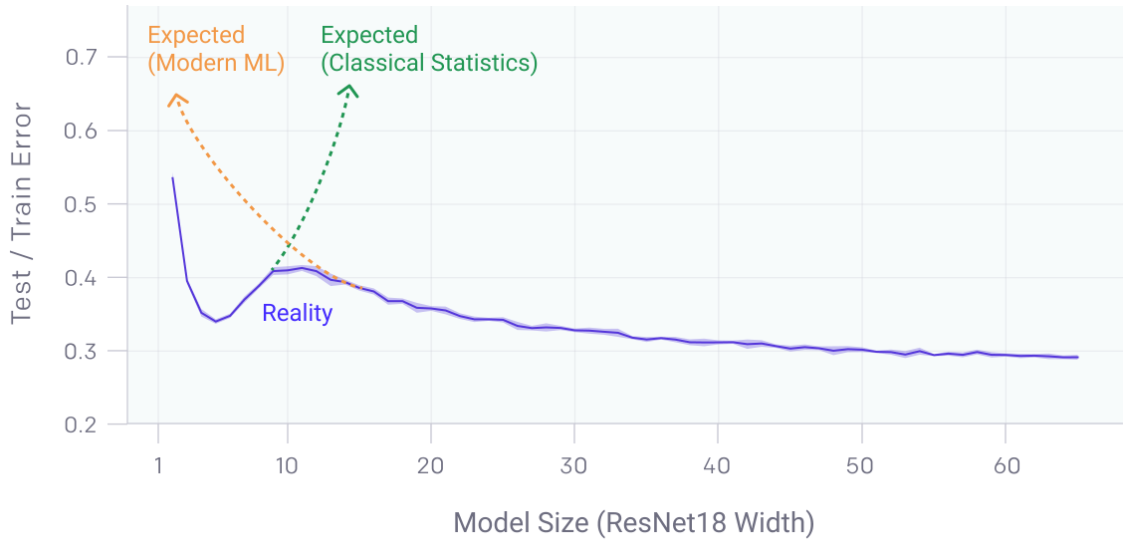
深度双下降法挑战了偏差-方差权衡的传统观点,即增加模型复杂度通常会导致过度拟合和更高的测试误差。
在现代深度学习模型中,尤其是在具有大规模数据集和架构的模型中,这种现象凸显了测试误差的非平凡行为:
- 初始下降:随着模型复杂性的增加,模型更好地拟合数据,从而减少偏差。
- 中级上升:复杂性的进一步增加导致过度拟合,模型开始在训练数据中捕获噪声,从而增加方差和测试误差。
- 第二次下降:超过一定的复杂性阈值后,模型变得非常强大,可以通过有效利用大数据集和正则化技术进行更好的概括,从而再次减少测试错误。
这一见解对于模型训练和架构设计具有实际意义,表明在某些情况下,增加模型复杂性和数据最终可能会带来更好的泛化性能,这与传统预期相反。正则化技术和训练期间的仔细监控对于有效引导这种行为至关重要。
从模型角度看待双重下降
-
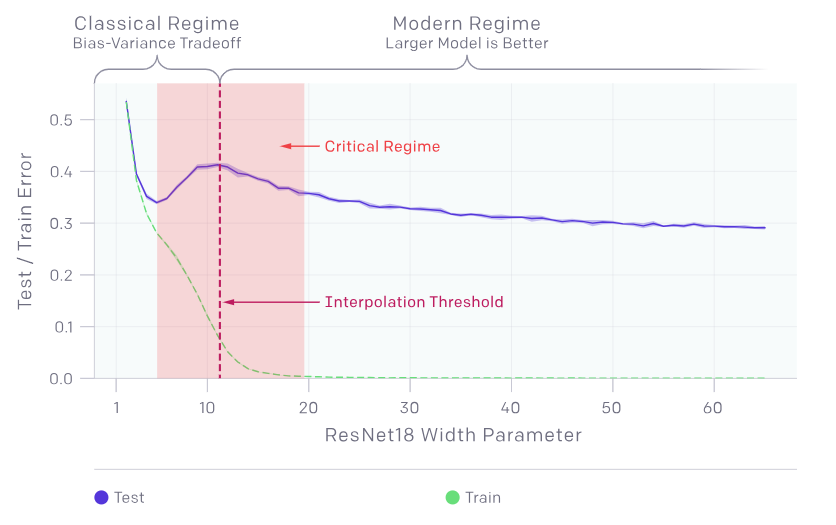
存在模型越大越差的情况。
-
模型级双重下降现象可能导致使用更多数据进行训练的效果变差。
-
Classical Regime(经典区间):
这里展示了传统的偏差-方差权衡理论。
在这个区间,随着模型复杂度增加,误差先下降,然后由于过拟合再次上升。
- Critical Regime(关键区间):
在这个区间,模型误差表现出较为剧烈的波动。
测试误差的峰值出现在插值阈值附近,此时模型刚好足够大以适应训练集。
- Modern Regime(现代区间):
在这个区域,随着模型规模进一步增加,误差再次下降,模型变得更好。
- 实际情况(Reality)(蓝色曲线):
展示了实际观察到的行为,测试误差先下降,然后在临界区间上升,最终在现代区间再次下降。
- 训练误差(Train)(绿色曲线):
随着模型复杂度的增加,训练误差持续下降,这表明模型在训练集上的拟合能力不断增强。
总结:
临界区间:双重下降现象主要在临界区间出现,这里模型误差的波动显著。
现代区间:在足够大的模型下,误差再次下降,证明更复杂的模型在处理大规模数据时有更好的表现。
数据和模型复杂度的关系:双重下降现象提醒我们,在设计和训练模型时,不能简单地依赖增加数据和模型复杂度来提升性能,需要考虑更多的因素和策略,如正则化和适当的早停策略。
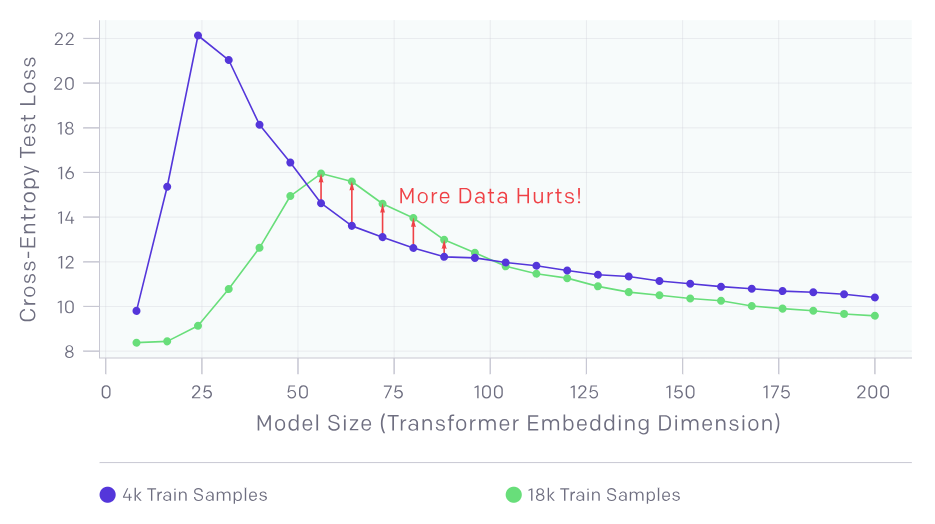
样本非单调性
- 样本非单调性(Sample-wise Non-monotonicity):
这个现象指的是,增加训练样本数量有时反而会损害模型性能,这与通常认为的更多数据会提升模型准确率的预期相反。
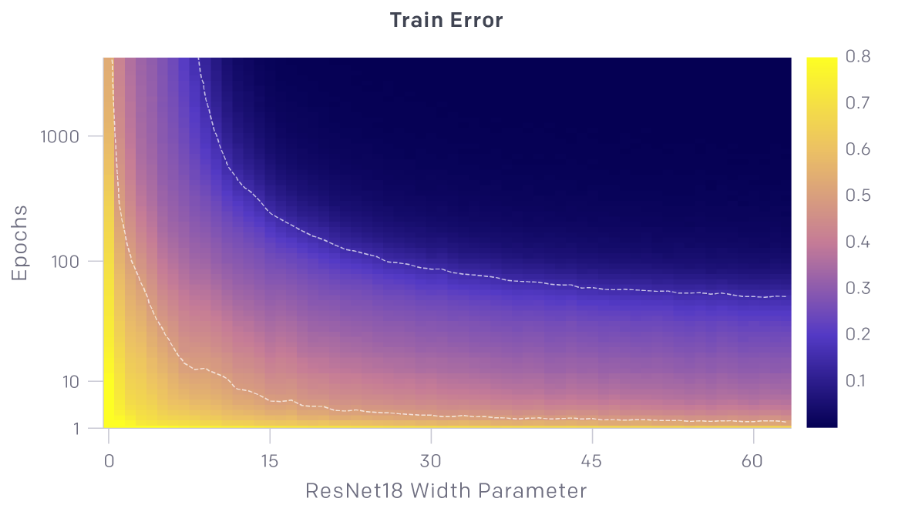
训练轮数与模型大小
 Credits
- Icons made by Becris from www.flaticon.com
- Icons from Icons8.com - https://icons8.com
- Datasets from Kaggle - https://www.kaggle.com/
- Jason Brownlee - Why Initialize a Neural Network with Random Weights?
- OpenAI - Deep Double Descent
- Tal Daniel
作者
arwin.yu.98@gmail.com

